27 Jan Precendential Percentages
Starting a new year always brings new perspectives, new ideas and new predictions. But every four years we also have something new: a presidential election. Politics is one of the most dividing subject matters we face in society, right next to religion. No matter what side you are on, I fundamentally believe that both parties want the greater good for the United States. Although that is up to interpretation and matter of opinion, both sides should agree that candidates have the fundamental motivation of providing a safe and prosperous United States to its citizens.
If this year’s debates are any indication of what is to come during the presidential elections, this will definitely be one for the record books. Entertainment aside, from an economic perspective we are in very unique times for the incoming president. The Fed has embarked on rising interest rates, oil prices are at multiyear lows, unemployment is improving, and national security is top of mind. The Middle East is a tinder box and Europe is dealing with a refugee crisis that is having a broader reach overseas. World growth is expected to be muted with divergent monetary policies. Investors are looking for a leader that will take the U.S. economy to the next level. To get to that next level, a driving underlying factor of that prosperity is the economy.
As investors, we look to history and attempt to make connections. We anticipate what could happen under similar scenarios. Although history may not repeat itself, it does have a record of rhyming. Precedents that were set are used as a starting point to prediction. Therefore, we thought we would take a look at the historical performance of the stock market during election cycles and under different political party control. Our goal is to bring a nonpartisan, objective point of view.
We should focus on policy not party.
Although not a new concept, the theory behind market performance and election cycles was first developed by Yale Hirsch; who was the founder of the Stock Trader’s Almanac. His theory states that U.S. stock markets are strongest leading up to an election and are weakest following the election of a new U.S. president. Intuitively, this makes sense as incoming presidents usually have difficult economic decisions to make early on in their presidency in hopes that they will come to fruition by reelection. New initiatives may also be announced post-election heightening the level of economic uncertainty which can keep the stock market at bay. Until recent presidencies, Presidential Election Cycle Theory displayed some significance until the Dow Jones Industrial Average was positive in the years following the elections of George H. W. Bush and Bill Clinton. Further complicating things were also the two elections of George W. Bush that were followed by down years and after the Dow going positive following Barack Obama’s election. For these reasons the US Presidential Election Year Cycle phenomenon has been heavily scrutinized by both Wall Street and Main Street.
During our Member reviews, a common question that is brought up is this year’s election and who would be best for the economy. Although we try to avoid political discussions, trying to decide which party is “best” for investors is a slippery slope. Broadly speaking, markets generally perceive (rightly or wrongly) the GOP to be the more business-friendly party. However, this does not necessarily translate into better stock market performance when looking at data going back to 1900. As you will see from the chart below, the Dow Jones Industrial Average (DJIA) has annualized returns of 7% under a Democratic President versus 3% under a Republican President.
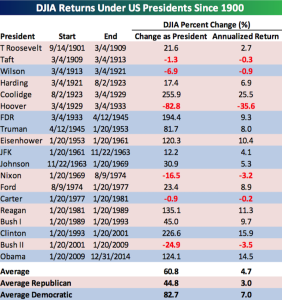
We understand that markets are not the same today as they have been historically. Additionally, there were some significant statistical anomalies. For example, the Great Depression and the Financial Crisis were both during Republican presidencies. Without getting into the actions and details that led up to both of these events, looking purely at the numbers; Democrats have better stock market performance under their leadership.
So does this mean if a Republican is elected we will have inferior performance compared to a Democrat in office? Not necessarily. Leading up to elections, if it seems that the GOP is likely to gain power, markets tend to have rallied. This, of course, is only a temporary phenomenon, as actual policy is slow to take effect and markets always quickly re-focus on economic data, earnings and other fundamentals that actually matter.
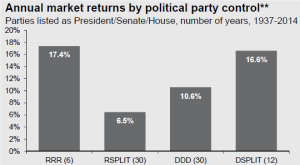
Regardless, markets have performed under various combinations of political leadership (Presidency, Senate, House – Democratic or Republican). From the chart above you will see that having a Republican controlled presidency, senate, and house has garnered the best returns since 1937. But if we have a Republican president and a split senate and house, historic performance is not as favorable. One silver lining is that no matter the combination of political leadership the market has had positive returns over time. But, keep in mind; presidential elections occur only every four years, so there is not an extensive amount of data to make comparisons.
Despite what party the president may belong to, it is impossible to isolate the market’s reaction to the announcement of a new policy, from the market’s response to its implementation – and beyond that, its actual impact. All of these actions happen with long lags, and anyone who says they can measure this is probably wrong. Drawing conclusions from historical data may be futile; therefore we should focus on policy not party. The political stakes in elections often translate into changes in policies that can reshape the economic environment. Elections can significantly increase political and social uncertainty. These factors have the potential to affect all asset classes and influence changes in the economic outlook. If there is one guarantee – it is that the markets will be watching this election very closely, and so will we!