27 Aug This time, is it different?
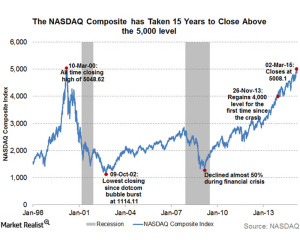
In March of 2015 the NASDAQ composite crossed the 5,000 barrier for the first time since the dot- com bubble of 2000. It has been a long 15 years since we have seen such levels. We have had booms and busts. As we currently sit at all-time highs, many investors who remember the dot-com era wonder if we are in another bubble. A lot has changed over the years. Companies, markets, and fundamentals are all different. We thought we would take a stroll down memory lane and see what is different this time. As investors, to have an idea where we are going, we have to understand where we have been.
2000
In 2000, American Beauty won the Oscar for Best Picture and Survivor was the top rated TV show. A gallon of gas cost $1.26. Tiger Woods became the youngest player to win a Grand Slam in Golf and the NASDAQ composite reached 5,000. During this time the stock market was in a bull market with technology names leading the charge.
Technology companies made up 65% of the NASDAQ composite with average price to earnings ratio (a common ratio to determine valuation multiples) of 189.7 (Yes 189.7!!!).
Defying any fundamentals or rationale, earnings did not matter. It seemed all a company needed to do was add an “e” to the front of their name or a “.com” to go up in value. The Federal government had recorded its largest budget surplus in nearly 50 years in 1998. At the end of 1999, the U.S. economy grew at a rate of 7.1%, and the unemployment rate stood at 4%.
Fueling the fire was mom and pop retail investors chasing performance of the next big IPO. In the year leading up to the crash there was 397 IPOs. With names like VA Linux rocketing up 698% the day it goes public makes you understand the frenzy that these IPOs created. So much so that people were quitting their jobs to become day traders. But, since all good things must come to an end, the NASDAQ composite peaked at 5048.62 on March 10, 2000. As accounting scandals such as WorldCom and bankruptcies plagued the market, investors lost confidence and we all know how that chapter ended – The bubble popped later that year. It is estimated that investors lost over $5 trillion dollars during the downfall. While not realizing the magnitude at the time, we were in the early innings of one of the most revolutionary times in technology and the internet in the ten years leading up to 2000. The end of the bubble was truly an inflection point in American history.
Today
So what has changed? Today, the NASDAQ is much different. Many of the dotcom companies do not even exist anymore. The U.S. economy is still recovering from the financial crisis. Growth remains below 3%. The unemployment rate is improving and is now at 5.3%. The Federal Reserve is still trying to support growth while keeping interest rates close to zero. From a fundamental perspective, there is a stark contrast. Price to earnings ratios are now just above 20. Cash flow is now (once again) important. The technology companies are generating cash at a rate that’s far greater than the companies whose stock-market value drove the NASDAQ in 2000. Apple, the biggest name in the NASDAQ today was barely on the radar in 2000. Apple now generates over $30 billion in cash per quarter. It has since become a behemoth with a market capitalization of over $750 billion.
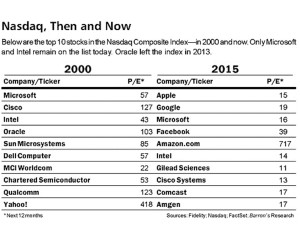
Although still tech-heavy, about 43% of the NASDAQ is in technology with new sectors such as social media, digital marketing and advertising, and biotech developing. U.S. stock market values have once again been driven by the prospects of innovative new companies that are changing the world with their growth potential. Disruptive technology such as Internet search advertising and social media are two sectors that did not even exist in 2000. Financial, consumer services and health-care sectors have also seen their weightings more than double within the composite. Among the nontechnology companies ranked in the top 20 today are the biotechnology companies Gilead Sciences, Amgen, Celgene and Biogen Idec as well as the retailers Walgreens, Boots Alliance, Costco, eBay, Priceline, and Starbucks.
Of the top 20 NASDAQ companies by market capitalization in 2000, only four remain in the top 20 today. Microsoft, Cisco Systems, Intel and Qualcomm are the seasoned veterans while eight of the top 20 no longer exist; either as a result of bankruptcy or acquisition, and several are shells of their former selves. Google, which ranks second by market capitalization went public in 2004 at $85 a share, giving the company a market value of $23 billion. Today, Google’s market capitalization is over $390 billion. Facebook, ranks fourth by market capitalization. It went public in 2012 and is already valued at over $250 billion.
As easy money continues to flood the market and investors look for growth anywhere they can find it, many investors think we could be witnessing another bubble in the making. NASDAQ 5000 is just a psychological headline number. Adjusting for inflation the NASDAQ would have to reach almost 7000 to match the highs of 15 years ago. There are real companies now that have cash flows and are no longer valued on cash burn rates and “eyeballs”. Although there will always be a level of speculation in the market, what we are seeing today is nowhere near what we saw in 2000.