07 Feb Viewing Volatility
Viewing Volatility
What a week it has been in the market! At one point, the Dow was down 1,600 points—and then recovered half of that back in a matter of minutes. The Dow ended up closing down 1,175 points—its worst one-day point decline in history. The CBOE Volatility Index, which was hovering in the 10–12 range, spiked to 50 for the largest percentage increase ever.
After years of being relatively calm, the S&P 500 slid down 2.1% February 2nd, followed by another plunge of 4.1% on February 5th. This drop represented the index’s largest single day decline since August 2011, when it fell by 4.5%. 404 trading days had elapsed since the market last experienced a 5% drawdown, the longest stretch of time in nearly 90 years! Since 1929, pullbacks of 5% have occurred after 92 days, on average.
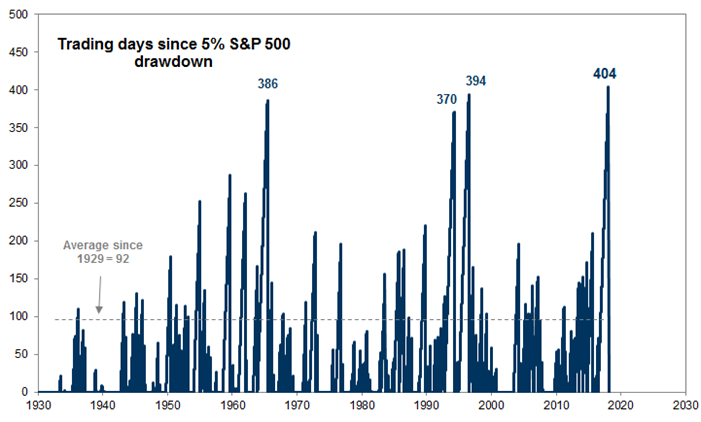
Source: Goldman Sachs Global Investment Research
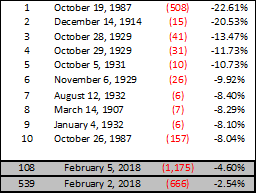
In terms of percentage, though, last week’s volatility was far from being historic when referring to declines in the Dow. As shown below, it ranked as the 108th largest single-day decline in the 118-year dataset.
Why are global markets selling off?
The market has been on an historic run, continually setting record highs last year and this year in January. The recent drops in U.S. and global equity prices could be viewed as overdue given the strength and speed of those recent market gains. Valuations are generally rich, but not excessive. Investor sentiment and the Relative Strength Index were at historic highs. The market has felt overbought, and any investor that has been in the markets for a while knew it wasn’t a matter of if—but when—it would see a correction.
The broad narrative is that the markets are worried about higher interest rates, higher inflation, and a more hawkish Fed that could slow our current economic expansion. This was triggered by a better than expected jobs report that showed that U.S. wage growth had increased by the highest monthly rate since 2009. As yields have climbed from 2.43% to 2.88% on 10-year treasury bonds, the market has essentially begun to reprice risky assets based on these assumptions.
In addition, we saw a massive unwinding of volatility hedges, and index/ETF rebalancing into the market close, producing higher volatility. We believe this was algorithms (lightning-fast trading models) automating orders when certain levels—or triggers—are hit within a particular index. The Dow falling 1,600 points—and then quickly recovering in a matter of minutes—led us to believe the sell-off was more technical than fundamental.
Is this the end of the bull market?
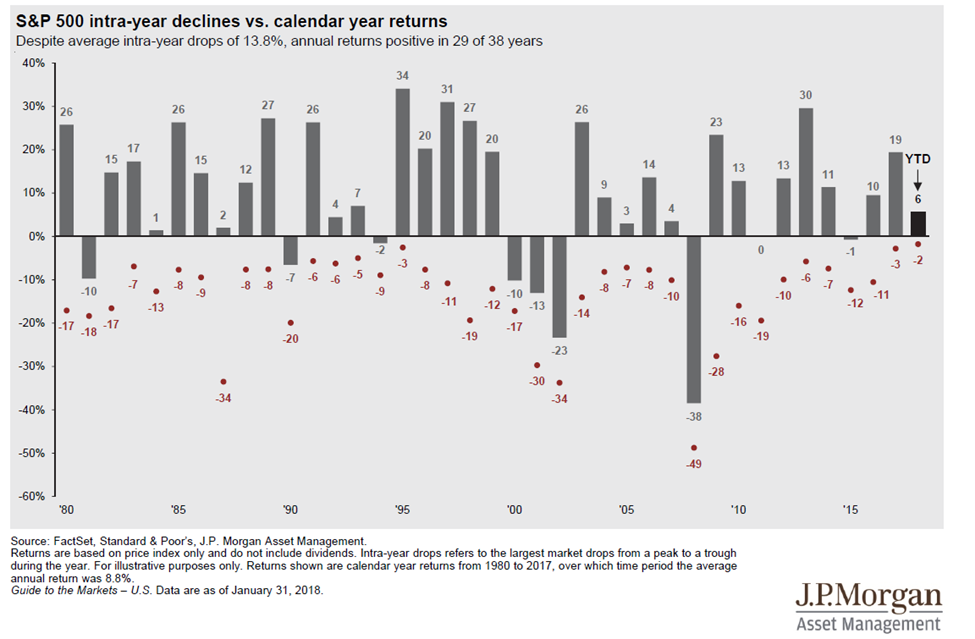
At Maclendon, we do not believe this is the end of the bull market. We view this as more of a movement to a more-normalized volatility environment. As the chart below illustrates, the average intra-year decline of the S&P 500 is 13.8% over the past 38 years, with 29 of those 38 years producing positive returns.
The global economy is still showing no signs of deteriorating, and corporate profitability is strong. Both the U.S. and global economies are expanding at a strong pace in 2018, with relatively low inflation and interest rates. Yes, U.S. growth will eventually show signs of slowing down, but that is part of a normal cycle. We do not see any specific risks of recession at this stage…yet. Fourth quarter earnings so far have seen 77% of companies beat expectations on earnings, and 70% beat expectations on revenues. In addition, the Tax Reform Act has significantly reduced the tax load on U.S. corporations, suggesting the possibility of a double-digit gain in year-over-year EPS for 2018.
We realize that one higher average U.S. earnings print doesn’t make a trend; a quick increase in inflation and rates are two of the risks building in 2018 that could lead to a spike in volatility, much like we saw last week. Also, rising Treasury yields can translate into higher borrowing costs (such as interest rates on mortgage loans) and higher borrowing costs, in turn, could discourage consumers and businesses from borrowing to make purchases and investments, ultimately slowing the economy. Rising wages and other input costs eventually could start to weigh on corporate margins, and higher yields may make bonds relatively more attractive than stocks.
So—what is an investor to do?
We believe this is an opportune time to reevaluate your risk tolerance and your portfolio to make sure the recent movements are in line with your parameters. Investors need to be cognizant of the fact that market movements may leave them in a very different position from where they planned to be. In the long term, establishing proper asset allocation, rebalancing a portfolio and diversifying investments to help mitigate the impact of volatility on one’s portfolio can significantly influence the likelihood of a desired outcome.
These market moves serve as a reminder that volatility is done hibernating, but there are plenty of reasons to remain optimistic about the year to come. Economic and earnings fundamentals continue to be supportive for equities. We continue to witness synchronized global growth with corporate earnings growing at a double-digit pace in the U.S. Interest rates and inflation are still relatively low in developed countries; in credit markets, credit spreads indicate positive fundamentals―the yield differentials that corporate bonds and other bonds over U.S. Treasuries remain very tight by historical standards, suggesting that fixed income investors expect strong economic and earnings growth to continue, limiting debt defaults.
Although short-term volatility swings can be difficult to stomach, we believe it’s important for long-term investors to maintain a steady course. We advise shifting focus away from short-term trends and concentrating on long-term investment strategy. The most important thing is to avoid letting emotion determine your actions (such as moving everything to cash) and potentially jeopardizing ultimately achieving your goals.
Note: This Maclendon Monthly was written on February 7, 2018 and does not address market activity after that date.